PERFORMANCE
Weighted-Rope Performance
Research and exercise principles behind joint loading, muscular endurance, training surfaces and the role of weighted-rope conditioning.
Jumping rope and your knees
There’s a common belief that rope jumping is hard on the knees. For healthy knees, the mechanics point the other way: when it’s done correctly. A 3D motion-analysis study found that bounce rope-skipping produces lower hip and knee joint loading than running, and its authors described it as a hip- and knee-protective weight-bearing exercise (though loading is higher than walking).¹ Studies of skip-pattern landings likewise report lower knee joint contact forces than running.² The key is technique: a low bounce a couple of centimeters off the floor, landing on the ball of the foot, so the ankle and calf absorb the load.³ Jump high, land flat, or train on concrete, and the picture changes: which is why form and surface are part of the program, not afterthoughts.
What rope work builds
Turning and landing a rope is a full-body action. Its anatomical demand: mapped in detail in a biomechanical analysis: runs from the quadriceps, hamstrings, gastrocnemius, soleus, and glutes through the trunk to the shoulders, forearms, and grip.³ Well-conditioned muscle and tendon around a joint improve its support, stability, and shock absorption; in rope jumping, the ankle, knee, and hip musculature act as the shock absorbers that dampen each landing.³ So rather than wearing the knee down, well-programmed rope training strengthens the muscles that support and stabilize the hip, knee, and ankle. Because the loads are light and the repetitions high, the adaptation is best described as full-body strength-endurance, not maximal strength.
The surface most people overlook
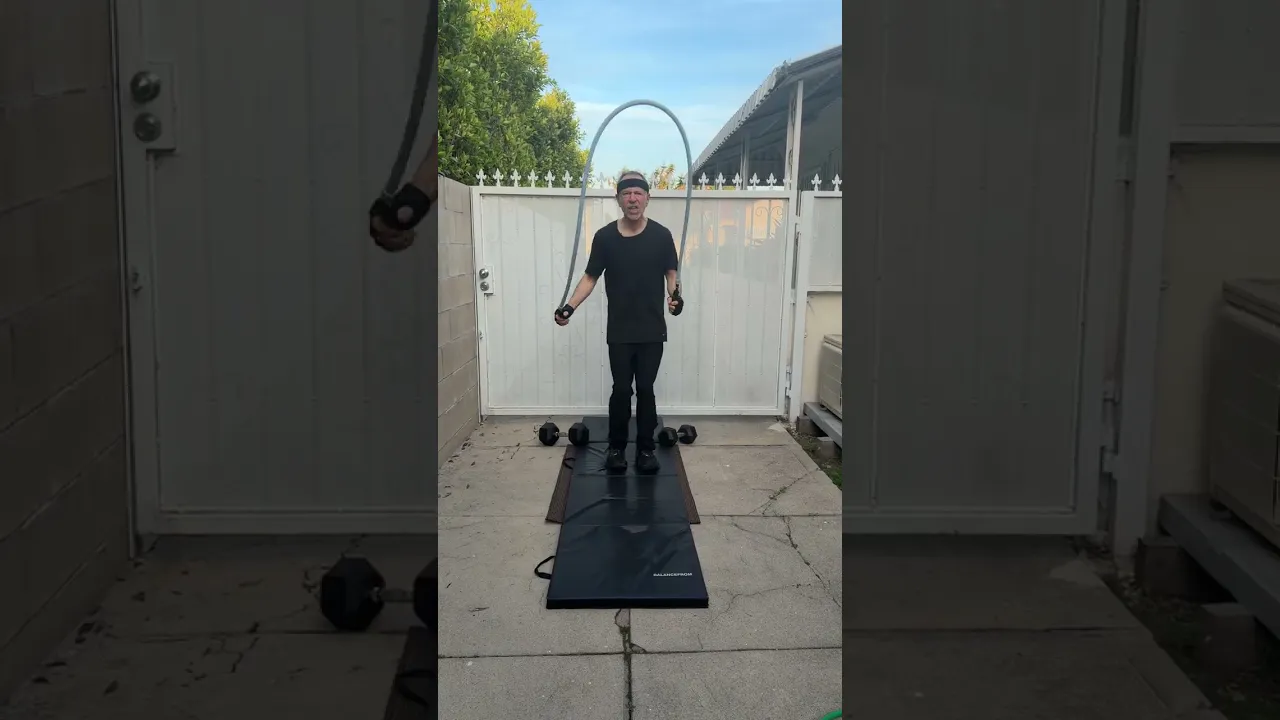
Much of rope jumping’s rough reputation comes from where it’s usually done: on hard floors. The landing surface changes the loading. A cushioned surface absorbs force over a longer time and distance, reducing the frequency of shocks the body absorbs.³ Footwear and jump style matter too: cushioning lowers the peak loading rate,⁴ and a low bounce produces markedly lower ground-reaction force than a higher, alternating step.⁵ Controlling the surface: a proper cushioned mat: is a deliberate, and underappreciated, part of how JumpIron is programmed.
A lower-impact complement: not a competitor
None of this argues against running or lifting. For many people, rope work is an efficient, lower-impact way to build and maintain conditioning: a complement to running, or a partial substitute when you want an aerobic and anaerobic stimulus with less joint load and less time. It also removes a hazard running carries: on a mat in a controlled space, there’s no uneven ground, no traffic, no trip-and-fall exposure. For athletes who lift, the relationship runs mostly one way: heavy, full-range strength training reliably improves endurance economy and durability,⁶ raising the ceiling that rope conditioning then draws on: while a short, low-volume rope session sits well below the endurance dose linked to any meaningful interference with strength or muscle gain.⁷
References
1. Mullerpatan R, Shetty T, Singh Y, Agarwal B. Lower extremity joint loading during bounce rope-skip in comparison to run and walk. Journal of Bodywork and Movement Therapies. 2021;26:1–6.
2. McDonnell J, Zwetsloot KA, Houmard JA, DeVita P. Skipping has lower knee joint contact forces and higher metabolic cost compared to running. Gait & Posture. 2019;70. (skipping gait; corroborates low-load landings)
3. Pitreli J, O’Shea P. Rope jumping: the biomechanics, techniques of, and application to athletic conditioning. NSCA Journal. 1986;8(4):5–11, 60–61.
4. Li J, Wu K, Ye D, Deng L, Wang J, Fu W. Effects of barefoot and shod conditions on lower-extremity kinematics and kinetics in jump-rope skipping. Bioengineering. 2023;10(10):1154.
5. Influence of different rope-jumping methods on adolescents’ lower-limb biomechanics during the ground-contact phase. 2022. (bounce jump: lower vertical GRF and loading rate than alternating jump)
6. Llanos-Lagos C, et al. Effect of strength training programs on middle- and long-distance runners’ economy: a systematic review with meta-analysis. Sports Medicine. 2024.
7. Wilson JM, Marin PJ, Rhea MR, et al. Concurrent training: a meta-analysis examining interference of aerobic and resistance exercises. J Strength Cond Res. 2012;26(8):2293–2307.
The authorized January 9, 2026 workout video accompanies the recorded heart-rate data presented below.
Total recorded time
15:26
Starting heart rate
71 bpm
Average heart rate
130 bpm
Maximum heart rate
161 bpm
Time at or above 153 bpm
3:40
Time at or above 158 bpm
1:32
Recorded workout values from January 9, 2026. They are exercise and wearable-device measurements, not medical measurements or normative ratings.
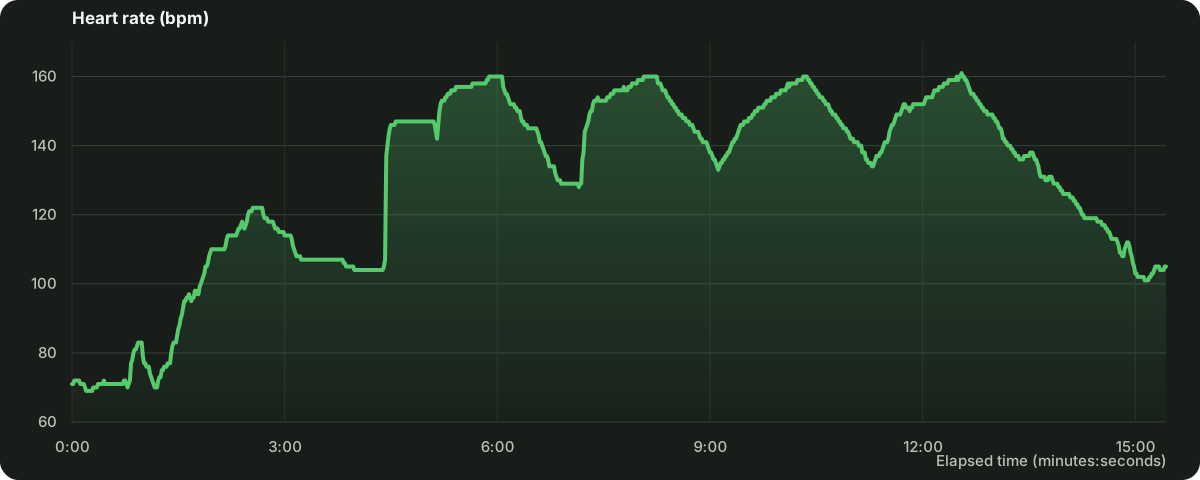
The continuous trace shows heart rate across 15 minutes 26 seconds. The recorded heart rate averaged 130 bpm, reached 161 bpm, remained at or above 153 bpm for 3 minutes 40 seconds, and remained at or above 158 bpm for 1 minute 32 seconds. Source: second-by-second Intervals Pro CSV recorded January 9, 2026. Lap markers are not used as set boundaries.
AI helps organize and summarize the submitted workout information. Jim Levy reviews the analysis and makes every coaching decision.
Heart-rate response
The recorded heart rate began at 71 bpm, averaged 130 bpm and reached a maximum of 161 bpm during the 15:26 record.
Time at higher intensity
The record contains 3:40 at or above 153 bpm and 1:32 at or above 158 bpm.
Cooldown recovery
Heart rate moved from 160 bpm entering cooldown to 137 bpm after one minute, 118 bpm after two minutes and 105 bpm at the end of the recorded cooldown.
Coaching application
Jim considers these measurements together with the complete workout, participant feedback and prior records before deciding whether subsequent training should remain the same or change.
160 bpm
Entering cooldown
137 bpm
After one minute
118 bpm
After two minutes
105 bpm
End of recorded cooldown
Jim considers recovery data together with the full workout and participant feedback.
JumpIron may review workout completion, heart-rate response, recovery, video observations when useful, participant feedback and tolerance, prescribed intervals, equipment progression, prior workout history and coaching decisions. Subsequent workouts can be compared with earlier records to inform progression.
This example summarizes exercise and wearable-device information. It is not a medical test, diagnosis or medical recommendation.

The Apple Watch displays the current interval, remaining time, heart rate, target heart-rate range, prescribed rope weight and the next interval.
This photograph comes from a separate workout and is not part of the January 9 record.
JumpIron begins with an individual consultation and instruction, then uses programmed workouts, submitted data, video when useful and continued coaching oversight to guide progression.
Book a Free Consultation